Autodesk Revit Model Analytics Tracks Cloud Model Health Across Projects
- Published
- Author
- Edwin Prakoso
- Reads
- 741
Revit Model Analytics scores cloud models using sync time, warnings and content indicators, helping teams spot trouble before it slows work.

Slow syncs and unstable models can disrupt an entire Revit team. Autodesk Model Analytics gives teams working with cloud models and cloud worksharing a way to monitor selected model health indicators over time, so they can see where attention may be needed before performance problems become harder to diagnose.

What the reports measure
A model can open successfully and still be difficult to work with. Sync duration, file size, warnings and stability all affect day-to-day project work: long syncs delay designers, coordination can slip, and investigating a model that has become sluggish may take hours.
Model Analytics focuses on common contributors to model health, including Revit warnings, links, imported CAD files and images, in-place families, plan regions and sync time. These indicators can point a BIM manager toward areas to inspect, but the dashboard doesn’t diagnose every cause of a problem. A high count may warrant investigation; the appropriate fix depends on how the model is being used.
Some practices can add avoidable weight or complexity. Imported CAD geometry, for example, is counted separately from CAD links. In-place families can be harder to reuse and manage than loadable families when repeated content is needed. Unresolved warnings can accumulate, while teams syncing with different minor Revit versions—such as Revit 2027.1 and 2027.2—may encounter coordination issues.
How Model Analytics collects data
Autodesk Model Analytics (AMA) is a cloud-connected Revit add-in for cloud models. When someone syncs a workshared model or saves a cloud model, the add-in sends model data to a cloud service. The resulting reports are available through Autodesk Forma Insight, so project members can review them without opening Revit or running a separate analysis tool.
Reports can be viewed at three scopes: an individual model, a project or an entire hub. The project and model reports are read-only for Project Members and Project Admins with Insight access. Executive access is required for the hub-wide view. BIM coordinators and BIM managers are likely to use the detailed indicators most, while the color-coded scores also give designers and project managers a quick way to spot models that may need attention.
Compatibility and setup
The feature supports users of Revit 2024 through Revit 2027 who work with cloud models or cloud worksharing. Model Analytics is off by default, and installing the add-in alone does not start data collection. The hub must first have the feature activated, and the add-in must be installed on each computer running Revit.
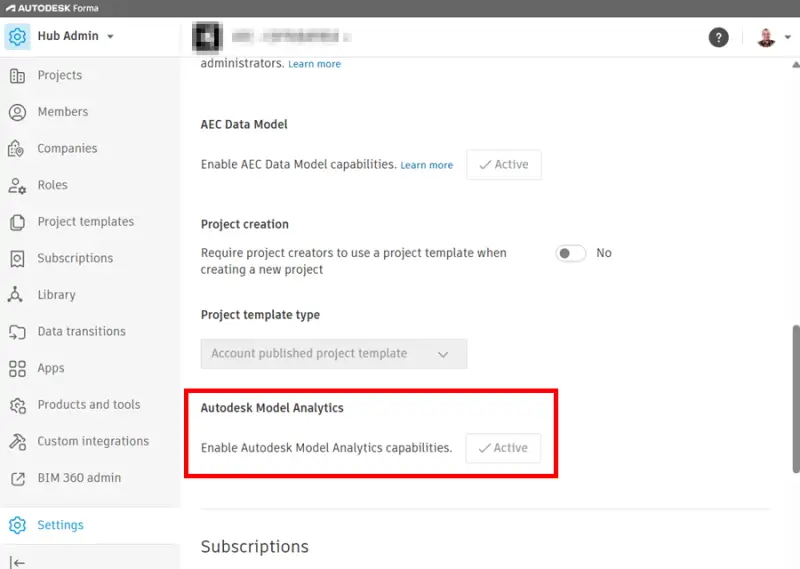
- An Account Admin activates Model Analytics for the hub through Hub Admin > Settings > Advanced.
- Install Autodesk Model Analytics for Revit from manage.autodesk.com, under Products and Services > Revit > View Details > Extensions, on every Revit computer that will contribute data.
- Sync a workshared model with Central or save a cloud model. Data appears after that activity. Earlier syncs and saves, along with work done in Revit installations that lack the extension, won’t have analytics data.
Once data is available, open the project in Autodesk Forma and select Insight > Model Analytics. Teams should account for the collection start point when comparing models: the dashboard can only show information recorded after the feature is enabled and the model is synced or saved with the add-in installed.
Scores and default thresholds
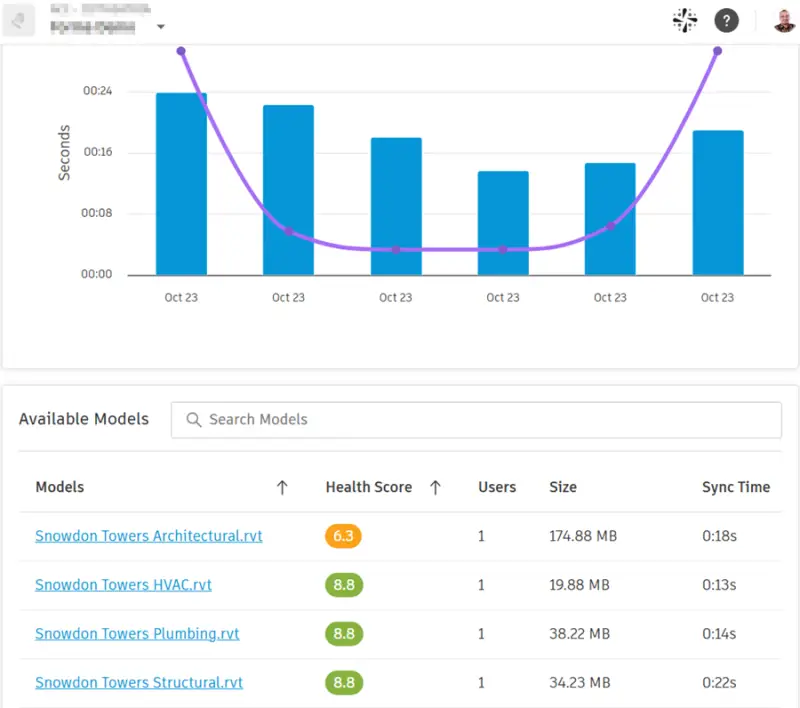
The Health Score combines the indicators into a score from 0 to 10. Green represents 7.8 and above, orange covers 5.0 to 7.7, and red means below 5.0. A history chart shows how the score changes over time, making it possible to see whether the measured health is improving or declining.
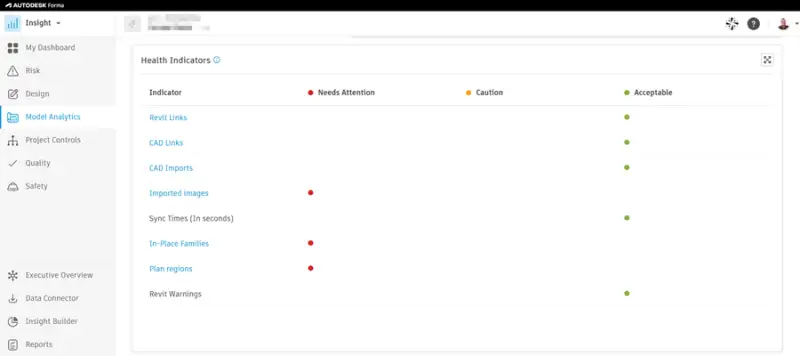
Individual indicators are marked Acceptable, Caution or Needs Attention according to default thresholds:
| Indicator | Caution at | Needs Attention at |
|---|---|---|
| Revit warnings | 100 | 200 |
| Revit links | 4 | 6 |
| CAD links | 4 | 6 |
| CAD imports | 1 | 2 |
| Imported images | 5 | 10 |
| In-place families | 1 | 2 |
| Plan regions | 3 | 5 |
| Sync time (seconds) | 25 | 50 |
A single in-place family reaches the Caution threshold, so that label should be read as a prompt to review the model rather than proof that the family is causing a performance issue. The thresholds can’t currently be edited. Autodesk’s Model Analytics help page explains how to interpret the reports.
Monitoring still depends on model maintenance
Model Analytics identifies patterns and provides a history of selected indicators; it doesn’t repair a model or decide which content should be removed. Someone still needs to review imported CAD, warnings, links and other flagged items in the context of the project. Its practical value is earlier visibility: regular monitoring can help teams notice a worsening trend while they still have time to investigate it, instead of waiting for long syncs or crashes to force the issue.