Voltage Monitoring Adds Context to In-System Scan Test Failures
- Published
- Author
- Aakash Jani
- Reads
- 352
A Siemens FPGA demo aligns in-system test activity with voltage and functional telemetry to help engineers investigate droop-related failures.
A scan failure can point to a structural defect, but it can also happen when a test pattern drives enough switching activity to cause a voltage droop. That distinction matters in deployed systems: a false failure can take a healthy processor out of service, while a real defect needs investigation. A demonstration combining in-system test with voltage sensing and functional monitoring shows how engineers can put those signals on a shared timeline.
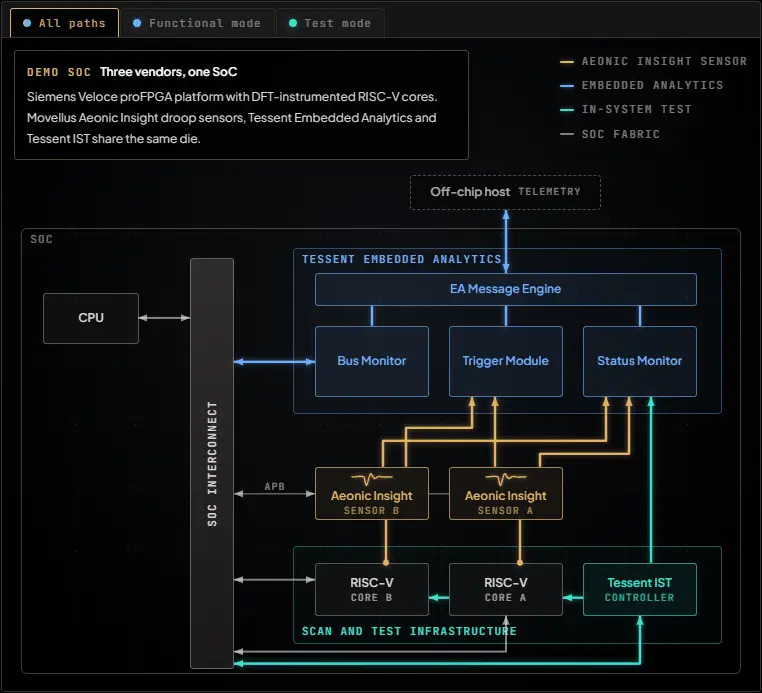
The setup extends an earlier monitoring demonstration by adding Siemens Tessent In-System Test (IST) to Movellus Aeonic Insight voltage-droop sensors and Tessent Embedded Analytics. It runs on a Siemens Veloce proFPGA platform. The target design contains multiple RISC-V cores equipped for design-for-test (DFT): they run workloads in functional mode and receive scan patterns in test mode.
Why test results need physical context
Scan patterns can produce intense switching, especially when long or multiple scan chains are active. If voltage falls during that activity, a test may fail even when the targeted logic has no structural defect. Depending on the cause, engineers might respond by slowing the shift clock, raising voltage or repartitioning scan patterns. Without measurements of conditions during the test, those adjustments—and decisions to reject a part—may be based on incomplete evidence.
The same issue follows IST into deployed equipment. Tessent IST brings selected structural tests into the system, so engineers can test a device without removing it. That capability can help investigate silent data errors: Meta has described testing across hundreds of thousands of fleet machines that identified hundreds of CPUs corrupting data without reporting an error. Google has reported a similar rate in its fleet, and Amazon has presented results from using IST on AWS silicon. These examples illustrate why testing in service can be useful; they also make clear why a pass/fail result alone may need more context.
Droop during a test depends on the applied patterns, sensor locations and device conditions. Telemetry can help answer practical diagnostic questions: Did the voltage event overlap the test? Which core was being tested? Was other system traffic active at the same time?
Putting sensors and test on one timeline
In functional mode, the Movellus droop detector is configured through an APB path. It can issue a hardware event when voltage crosses a programmed threshold. Tessent Embedded Analytics receives that event through its trigger and message infrastructure. Its Status Monitor records sensor and system signals with timestamps, while a Bus Monitor tracks transactions on the system-on-chip interconnect. In this arrangement, a physical event can trigger collection of functional evidence that may help explain what was happening around it.
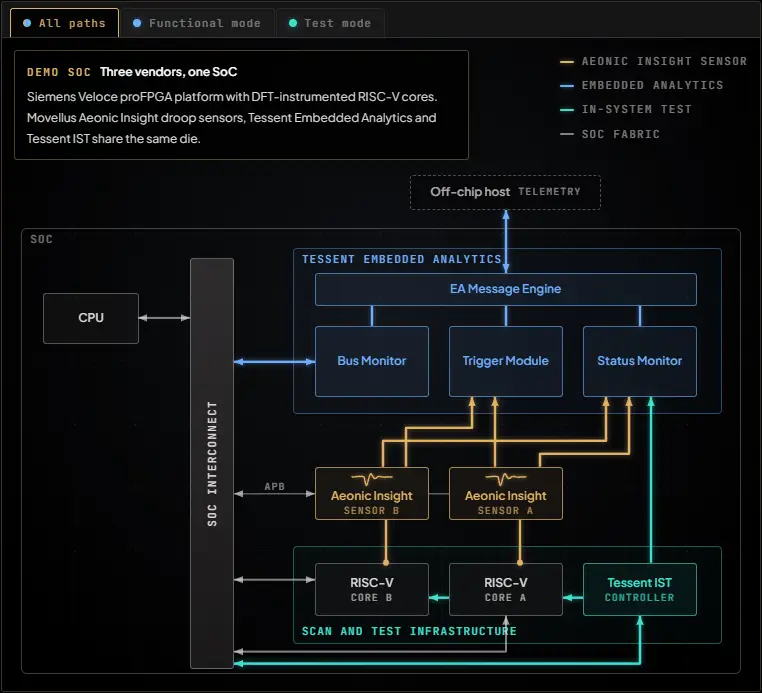
Fig. 1: Demo system including Tessent Embedded Analytics, the Movellus Aeonic Insight voltage-droop sensor, and scan-and-test infrastructure.
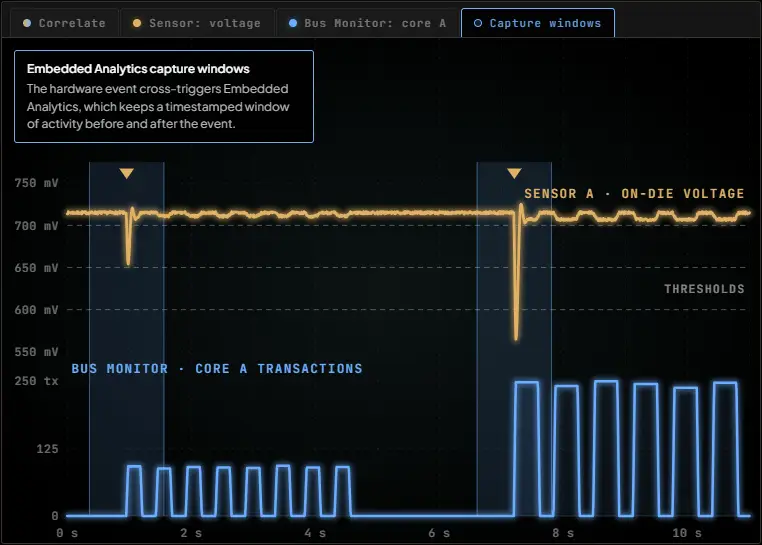
Fig. 2: Functional-mode workflow correlating voltage-droop events with timestamped processor and interconnect activity.
Adding IST extends this workflow into test mode. Test patterns run on the FPGA platform, while Tessent Embedded Analytics monitors an internal test-mode state. The Status Monitor records test start and stop activity, making it possible to align the test window with voltage-sensor data. The demonstration therefore relates three kinds of evidence: test execution, physical voltage behavior and functional system activity.
What aligned observations can show
Each signal has a distinct role. Structural test checks whether the targeted logic responds as expected. The voltage monitor records physical conditions during the test. Functional monitors show activity that may have contributed to those conditions. Combining them does not make telemetry a substitute for structural test; it gives engineers more context for interpreting its result.
For example, a voltage excursion that appears only with a particular pattern group gives the investigation a narrower starting point. If the excursion instead overlaps heavy traffic from a neighboring functional core, engineers can consider whether scheduling that workload at the same time contributed to the event. Comparing observations from multiple sensor locations may also help distinguish a local event from one shared across part of the power-delivery network.
These correlations are diagnostic leads, not proof of a cause. Their practical value is that they help narrow the search and reduce reliance on worst-case assumptions when engineers assess a failure. A pass/fail flag says whether the test met its criteria; aligned telemetry can help explain the conditions under which that result occurred.
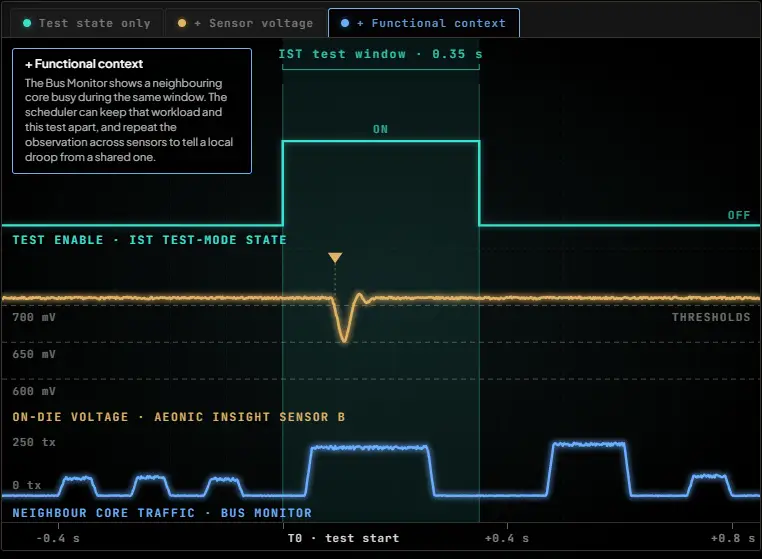
Fig. 3: Test-mode workflow aligning in-system test execution with voltage-sensor data using Status Monitor.
One voltage sensor across operating modes
The same droop detector can provide evidence during normal workloads and while structural test content is running. Tessent Embedded Analytics supplies timestamped context in both cases, connecting the physical signal to processor, interconnect and test activity. That continuity supports diagnosis across more of the system lifecycle, from functional operation through in-system testing.
The current FPGA demonstration runs IST patterns and correlates their start and stop times with voltage and functional-monitor data. The next development step described for the system is direct sensor access through iJTAG, creating a path to coordinate test control, sensor observation and functional telemetry through the deployed system. The central engineering takeaway is simple: when test results and operating conditions share a timeline, a failure gives teams more evidence to investigate.